 ultimate-guide
How to Build Profitable Entertainment Centers: A Guide
Last Updated: October 28, 2026
Quick Summary
Building profitable entertainment centers starts with a layout that puts play, food and beverage, and event space where they earn money, then a monthly cost model built on your own quotes. Break-even depends on contribution margin per guest, so track revenue per square foot, labor as a share of revenue, and payback period from day one.
- Profitability depends on revenue per square foot, operating costs, and how quickly the build-out is paid back.
- Use a line-item monthly cost model and replace the sample ranges with written quotes for your market.
- Calculate break-even visits by dividing fixed monthly costs by contribution margin per visit.
- Add group events and memberships so revenue is more predictable and slow days are cushioned.
- Confirm demand with a deposit-based waitlist and compare customer acquisition cost to first-visit margin before building.
Table of Contents
- What Makes an Entertainment Center Profitable
- Planning the Layout and Choosing Built-In or Freestanding Design
- Family Entertainment Center Revenue Streams
- Family Entertainment Center Operating Costs and Cost Calculations
- FEC Pricing Strategy for Attractions and Packages
- Entertainment Center Profitability Metrics to Track
- Validating Demand and Marketing to Customers Before You Build
- Booking a Feasibility Study Before Your Next Build
- Frequently Asked Questions
What Makes an Entertainment Center Profitable
Most people who open a Family Entertainment Center focus on the attractions and forget the math behind them. A profitable center is one where the revenue per square foot, the cost of running the building, and the time it takes to recover your build-out all line up. That is the core of how to build profitable entertainment centers, and it is worth getting right before a single wall goes up. At Turfway Entertainment, we consult with both new and established FECs.
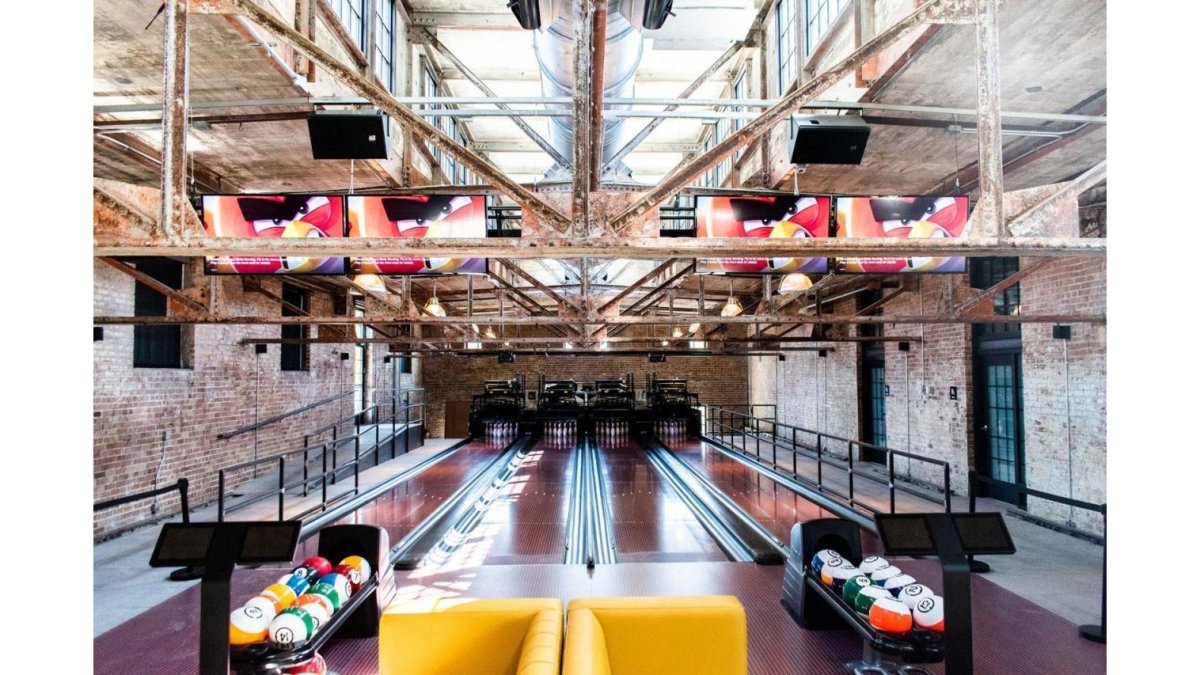
A profitable entertainment center is a venue whose recurring revenue from play, food and beverage, and events consistently exceeds its operating costs, debt service, and reinvestment needs, and that is the goal every owner should plan around when building profitable entertainment centers. That definition matters because a busy center can still lose money if its margins are thin or its spending is poorly controlled.
Think of profitability as a combination of three levers. Revenue depends on how many guests you attract, how often they return, and how much they spend per visit. Operating costs depend on labor, rent, utilities, maintenance, and the cost of goods you sell. Capital efficiency depends on how much you spent to open and how quickly the business pays that back. Weak performance in any one lever can erase strong performance in the others.
Planning the Layout and Choosing Built-In or Freestanding Design
Layout decisions made early shape your margins for years. A floor plan that forces guests to walk past the food counter to reach a game, or that leaves dead corners where nothing earns money, quietly costs you revenue every day.
Start by mapping your space against three zones: play, food and beverage, and event or party space. Reserve room for group events without letting them crowd your core attractions. Plan sightlines so staff can supervise play areas from the counter.
Next, decide how much you will build in place versus buy as freestanding equipment.
Family Entertainment Center Revenue Streams
A strong FEC rarely depends on a single source of income. Centers can spread revenue across several streams so a slow month in one area does not sink the whole business.
The main revenue streams are:
- Play and attraction admissions: Pay-per-play, unlimited wristbands, or timed sessions.
- Food and beverage: Often the highest-margin category when the menu is simple and the kitchen runs efficiently.
- Group events and parties: Booked in advance, which makes revenue more predictable and smooths out slow days. Learn how to maximize group event revenue at your FEC.
- Memberships and passes: Recurring income that rewards repeat visits.
- Retail and merchandise: Small but easy to add, and useful for capturing impulse spending at checkout.
Family Entertainment Center Operating Costs and Cost Calculations
Build a monthly cost model before you commit to a lease or an equipment order, and update it with real numbers as soon as you open. The goal is not a perfect forecast, it is a model you can revise with actual data. Maintaining this financial agility ensures you remain prepared to leverage various hospitality funding options should your initial operating expenses exceed your early revenue projections.
A line-item cost model you can copy
| Cost category | Typical monthly range | What drives it |
|---|---|---|
| Rent and occupancy (base rent, CAM, property tax) | $18,000-$40,000 | Square footage, market, lease term |
| Labor (wages, payroll taxes, benefits) | $25,000-$55,000 | Hours of operation, staffing ratio, wage floor |
| Utilities (HVAC, lighting, attraction power) | $6,000-$15,000 | Climate, building envelope, equipment draw |
| Maintenance and repairs | $3,000-$8,000 | Age of attractions, preventive maintenance schedule |
| Cost of goods sold (F&B, prizes, retail) | 25-35% of the revenue those lines generate | Menu mix, portion control, prize redemption ratios |
| Insurance, licenses, professional fees | $2,500-$6,000 | Coverage limits, state and local licensing |
| Marketing and customer acquisition | 3-6% of revenue | Channel mix, launch vs. steady state |
Break-even math, step by step
Worked example with round numbers:
- Fixed monthly costs: $40,000 (rent $20,000 + salaried labor $12,000 + utilities $5,000 + insurance $3,000)
- Average revenue per visit: $22
- Variable cost per visit: $10 (F&B ingredients $4, prize cost $3, payment fees $1, hourly floor labor $2)
- Contribution margin per visit: $12
- Break-even visits per month: $40,000 ÷ $12 ≈ 3,333
Payback and margin targets
Track three margin lines monthly: gross margin on F&B (aim to keep ingredient cost in the high 20s to low 30s as a percentage of F&B revenue), contribution margin per guest, and labor as a percentage of revenue. For a deeper look at optimizing the business model behind these numbers, see FEC business model optimization strategies. When any of these drifts outside your model, fix it before it compounds.
FEC Pricing Strategy for Attractions and Packages
Pricing guidance should always be tied to your local market.
Entertainment Center Profitability Metrics to Track
You cannot manage what you do not measure. The metrics below can help you assess your center.
- Revenue per square foot: Shows how well you use your floor space.
- Average spend per guest: Combines admission, food, and extras into one figure.
- Food and beverage margin: The percentage of food revenue left after ingredient costs.
- Labor as a percentage of revenue: Should stay within a range your model predicted.
- Event bookings per month: A leading indicator of future revenue.
- Repeat visit rate: Tells you whether guests are coming back.
- Payback period: How many months it takes to recover your build-out cost.
Validating Demand and Marketing to Customers Before You Build
Before you spend heavily on construction, confirm that enough people in your market want what you plan to offer, and that you can reach them at a cost your margins can absorb.
Step 1: Define the trade area and count the base
Draw a drive-time polygon around your site, commonly 15 minutes for weekday traffic and 20-25 minutes for weekend and party business. Inside that polygon, pull population, household counts, and the share of households with children under 18 from public census and regional planning data. A center needs a deep base of families and groups to fill weekday afternoons, not just Saturday nights.
Step 2: Audit competing supply
List every competing venue in the trade area and record four things: pricing, hours, the busiest times (check reviews and social posts for clues), and what reviewers praise or criticize. If the same complaint appears repeatedly, tired equipment, slow food, cramped party rooms, that is a positioning opening. If the market already has several strong operators at your price point, your concept needs a clear reason to exist.
Step 3: Test willingness to pay, not just interest
Interest is cheap; deposits are not. Run a pre-launch waitlist or founding-member offer with a small refundable deposit and measure conversion. A common pattern is that a few hundred sign-ups in a trade area of 100,000+ households signals real pull, while dozens suggest the concept needs work. Pair the offer with a short survey that asks about visit frequency, preferred days, party plans, and price sensitivity, and keep it to five questions so people finish it.
Step 4: Model customer acquisition cost before you open
Customer acquisition cost (CAC) is total marketing spend divided by new customers acquired. If you spend $3,000 on a launch campaign and bring in 150 new guests, CAC is $20. Compare that to contribution margin per guest from your cost model, if CAC approaches or exceeds first-visit margin, you need repeat visits or a higher average spend to make the math work. Track CAC by channel (local search, social, community partnerships, email) so you can shift budget to what converts.
Step 5: Build the marketing engine before opening day
A feasibility study can assess demand alongside your revenue and cost model.
Booking a Feasibility Study Before Your Next Build
Turfway Entertainment offers feasibility studies for new Family Entertainment Centers, along with operational health checks for venues already in operation. If you are weighing a new build or a major renovation, book a feasibility study with Turfway Entertainment to see what the process covers.
Request a consultation with Turfway Entertainment to talk through your concept, your budget, and the steps that make the most sense for your next project.
Frequently Asked Questions
How do family entertainment centers make money?
Most family entertainment centers earn revenue from several sources at once: admission or attraction pricing, arcade and game play, food and beverage, party and event bookings, and retail or memberships. Food and beverage and events often lift per-visit spending, while repeat play and passes support steadier monthly income. A profitable center balances these streams rather than depending on one, and tracks each stream separately so you can see which ones carry the business.
What makes a family entertainment center profitable?
Profitability usually comes from combining strong attraction revenue with controlled operating costs and high per-visit spending. Centers that keep labor scheduled to real traffic, price attractions with clear value tiers, and grow event and food sales tend to outperform. Regular review of margins by revenue stream helps owners catch weak areas early rather than after the year closes.
How much does it cost to start a family entertainment center?
Startup costs vary widely with building size, attraction mix, equipment, buildout, and location, so no single figure applies. Contact Turfway Entertainment for a consultation to discuss your project.
What metrics should an entertainment center track to improve profitability?
Useful metrics include revenue per visit, average spend per guest, attraction utilization, labor cost as a percentage of revenue, food and beverage margin, event bookings per month, and repeat visit rate. Tracking these together shows whether a problem comes from traffic, pricing, or cost. Reviewing them monthly against your projections makes it easier to adjust before small issues become losses.