 ultimate-guide
FEC Business Model Optimization Strategies That Work
Table of Contents
- Why Most FEC Business Models Leak Profit
- FEC Revenue Management Strategies That Diversify Income
- Data-Driven Decision Making for FECs: Metrics That Matter
- FEC Labor Cost Optimization Without Cutting the Guest Experience
- Tech Stack Integration and Sustainability as Optimization Levers
- Building the Business Plan Structure That Lenders and Investors Trust
- Risk Mitigation and Long-Term Scalability for FEC Operators
- Frequently Asked Questions
Last Updated: September 17, 2026
Why Most FEC Business Models Leak Profit
FEC business model optimization strategies fail most often because operators treat the venue as a collection of attractions rather than a portfolio of revenue and cost centers. Our operational health checks show the same pattern: a strong anchor attraction masks weak secondary categories until margins compress.
The Feasibility Study as Your First Optimization Tool
A feasibility study is a structured analysis of whether a proposed or existing FEC can generate sustainable returns given its market, cost structure, and competitive position. It is not a lender formality; it is your first optimization tool.
FEC Revenue Management Strategies That Diversify Income
FEC revenue management strategies work best when no single category exceeds roughly half of total revenue. Attractions draw traffic, but F&B, events, and loyalty carry the margin.
A practical structure many operators use:
- Anchor attractions: go-karts, bowling, laser tag, or a large climbing structure
- Impulse spend: arcade, redemption, and vending
- Planned spend: birthday parties, group events, corporate bookings
- Recurring spend: memberships, season passes, and loyalty reloads
Dynamic Pricing: The Revenue Lever Most FECs Ignore
The barrier is usually internal, not technical. Staff worry about guest pushback, but guests accept variable pricing when the value difference is clear and communicated at the point of purchase.
Data-Driven Decision Making for FECs: Metrics That Matter
Data-driven decision making for FECs means tracking a small set of metrics consistently rather than drowning in reports nobody reads: capacity use, revenue per visit, customer acquisition cost, length of stay, and customer lifetime value.
| Metric | What It Tells You | Review Cadence |
|---|---|---|
| Capacity use | How full your venue runs by hour and day | Weekly |
| Revenue per visit | Average guest spend across all categories | Weekly |
| Customer acquisition cost | Cost to bring in one new guest | Monthly |
| Length of stay | How long guests stay and what they spend | Monthly |
| Customer lifetime value | Long-term value of a repeat guest | Quarterly |
FEC Labor Cost Optimization Without Cutting the Guest Experience
FEC labor cost optimization means matching staffing levels to actual demand patterns rather than fixed schedules. It is the single largest controllable cost in most venues, and post-pandemic labor realities have changed the rules.

A workable approach:
- Pull two weeks of hourly attendance data by day and time block
- Map your current schedule against that demand curve
- Identify blocks where staffing exceeds demand by more than 20 percent
- Shift those hours to peak windows where guests wait for service
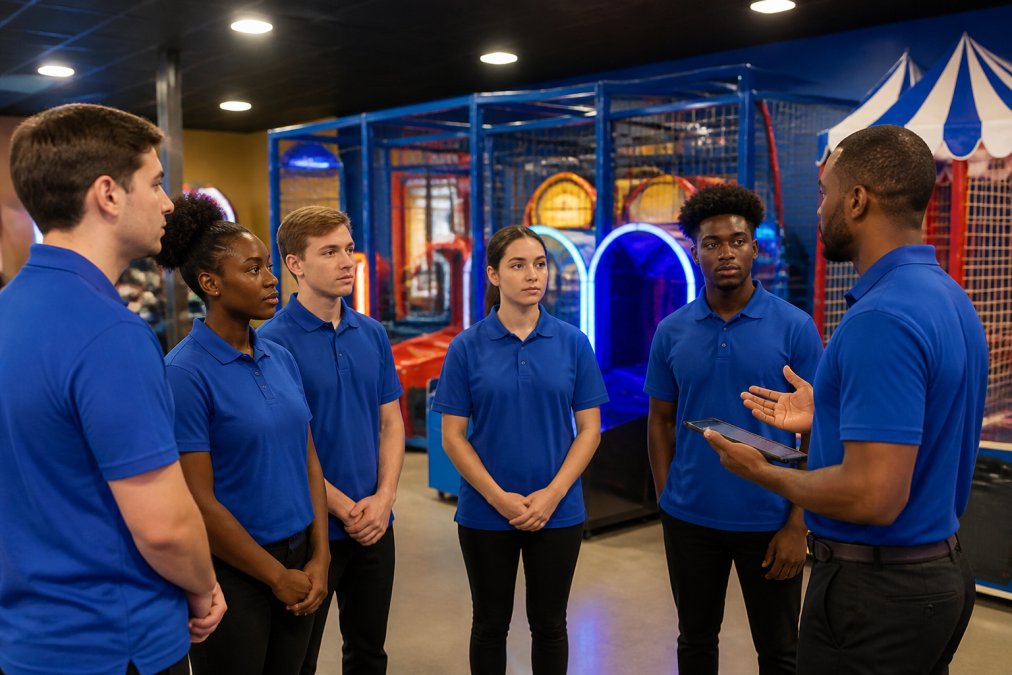
- Cross-train staff so one person can cover arcade, redemption, and front desk during slow periods
Tech Stack Integration and Sustainability as Optimization Levers
Tech stack integration means connecting your POS, booking, loyalty, and scheduling systems so data flows between them without manual entry, giving you one view of the guest instead of four disconnected ones. Most FEC operators run four to seven systems never designed to share data, and the integration layer is where real optimization happens.
The Integration Architecture That Actually Works
The practical pattern is a hub-and-spoke model built around a guest identifier: your POS issues a card or wristband number that becomes the primary key every other system references.
- POS to booking: When a party booking converts to a walk-in visit, the booking system pushes the reservation record to the POS so the guest's spend is attributed to the original booking source. This is how you learn which party packages actually produce repeat visits rather than one-time events.
- POS to loyalty: Every transaction writes to the loyalty ledger in real time, not in a nightly batch. Real-time writes let you trigger a reload offer at the moment a card balance drops below a threshold, which is when reload conversion is highest.
- Scheduling to attendance: Your time-clock or scheduling tool reads hourly attendance from the POS and builds next week's roster against the demand curve automatically. This is the same demand data the labor section uses, just piped in without a spreadsheet.
- CRM to everything: A guest who hasn't visited in 90 days gets flagged in the CRM, which triggers an email or SMS through the marketing platform. The CRM doesn't need to know what they bought, it needs to know they stopped coming.
What Integration Actually Buys You
The payoff shows up in three places: attribution (you can finally answer whether birthday party marketing produced repeat guests or one-time bookings), automation (scheduling, reload offers, and win-back campaigns run without staff pulling reports), and guest experience (a single profile means the front desk sees the same history the arcade attendant sees, so a guest with a problem gets recognized instead of re-explained).
Sustainability as an Operational Lever, Not a Marketing Line
Sustainability and ESG are moving from nice-to-have to operational lever, and the ones that pay back are tied to utility and waste lines. LED replacement across arcade and attraction lighting cuts the lighting portion of your electric bill with a payback short enough to show up in a single budget cycle. HVAC controls that schedule setbacks during closed hours and modulate on occupancy reduce the largest single utility cost in most venues.
Building the Business Plan Structure That Lenders and Investors Trust
The sections that carry the most weight:
- Market feasibility: visitor demographics, competitive supply, and demand evidence
- Financial modeling: three-year projections with stated assumptions
- Capital expenditure: itemized build or renovation costs
- Operational plan: staffing model, hours, and throughput assumptions
- Risk section: what could go wrong and how you'd respond
If you're converting an existing arcade into a full FEC, the plan structure shifts: you're not proving a concept from scratch but proving that incremental investment in new attractions and F&B produces incremental return. That's a different financial story, and lenders evaluate it differently.
Risk Mitigation and Long-Term Scalability for FEC Operators
Risk mitigation in an FEC starts with concentration risk: if one attraction, event category, or customer segment drives most revenue, a single bad season can destabilize the business. Spreading revenue across categories and customer types is the most reliable defense, but the risks that actually close venues are usually unmodeled: a lease renewal at a rent you can't cover, an insurance gap after an injury claim, and a capital refresh arriving before you've set aside the money.
The Risks That Actually Threaten an FEC
Lease and occupancy risk. Most FECs sign five- to ten-year leases with renewal options. The risk isn't day-one base rent but renewal rent after a decade of increases, when your anchor attraction is aging and a newer competitor has opened nearby. Modeling renewal rent into projections early makes reinvest-versus-relocate decisions clearer.
What Scalability Actually Requires
Business scalability follows the same logic as risk mitigation: documented systems, not just a successful venue. Operators who want to expand need SOPs for scheduling, pricing, and guest recovery that a new manager can execute without the founder present.
Reinvestment Discipline and the Refresh Cycle
Long-term sustainability comes down to reinvestment discipline. Attractions age. Guest expectations rise. A venue that hasn't refreshed its offer in five years is competing against newer venues with better equipment and fresher programming.
Frequently Asked Questions
What are the key revenue streams for a family entertainment center?
Most FECs rely on four core streams: attractions (arcade, mini-golf, go-karts, laser tag), food and beverage, birthday parties and group events, and retail or redemption prizes. Operators who optimize their FEC business model add secondary streams like corporate event rentals, seasonal camps, and sponsorship or naming rights for anchor attractions. Diversified income streams reduce the risk that a slow attraction season drags down total revenue, and they increase customer lifetime value by giving guests more reasons to return.
How can data analytics improve FEC operational efficiency?
Data-driven decision making for FECs starts with tracking capacity utilization, throughput per attraction, average length of stay, and customer acquisition cost. When you know which attractions drive the longest stays and which hours underperform, you can adjust staffing, pricing, and promotions accordingly. For example, if redemption games generate high traffic but low margin, you may renegotiate prize costs or shift floor space toward higher-margin anchor categories. Performance metrics turn guesswork into demand forecasting.
How do you optimize labor costs in an entertainment venue?
FEC labor cost optimization means matching staff hours to actual foot traffic patterns rather than fixed schedules. Pull attendance data by hour and day of week, then build schedules that flex with demand. Cross-train employees so one person can run the redemption counter, restock prizes, and assist with party setup during slow periods. Automate check-in and waiver processing to reduce front-desk headcount. Post-pandemic operators also report that flexible part-time pools beat rigid full-time rosters for controlling operational overhead without hurting service.
What role does a feasibility study play in FEC business optimization?
A feasibility study validates whether your market can support the revenue you project before you commit capital expenditure. It examines visitor demographics, competitor density, market penetration potential, and realistic attendance curves. For established FECs, a feasibility refresh can reveal whether a renovation or new anchor category will actually deliver investment ROI. Lenders and investors often require one before approving financing, so a well-structured study does double duty: it sharpens your strategy and strengthens your loan application.