 how-to
7 Tips for Improving FEC Profitability in 2026
Table of Contents
- Why Most FEC Profitability Plans Fail Before They Start
- Start With Your FEC Revenue per Square Foot Benchmark
- FEC Labor Cost Optimization Without Cutting Guest Experience
- Increasing Party and Event Revenue With Higher-Margin Packages
- Use Dynamic Pricing and Capacity Management to Fill Off-Peak Hours
- Control Operating Expenses: Energy, Inventory, and Shrinkage
- Retain Staff and Guests to Build Long-Term Profitability
- Conclusion
- Frequently Asked Questions
Last Updated: October 2, 2026
Why Most FEC Profitability Plans Fail Before They Start
Most family entertainment centers don't have a revenue problem. They have a cost problem hiding behind a revenue problem. This guide from Turfway Entertainment covers the operational levers that actually move tips for improving FEC profitability, and it starts with a hard truth: chasing top-line sales while ignoring labor, energy, and shrinkage is how centers stay busy and broke at the same time.
The failure pattern repeats across the industry. Owners add attractions, run promotions, and celebrate higher foot traffic, then wonder why profit margins never budge. The answer usually sits in three places: unmeasured costs, untracked capacity, and staff turnover that quietly eats the training budget.
Below, we break down seven tips for improving FEC profitability. Each one targets a specific line item, and together they turn a busy center into a profitable one.
Start With Your FEC Revenue per Square Foot Benchmark
FEC revenue per square foot is the total revenue a center generates divided by its usable square footage. It tells you how hard every part of your building is working.
Here's how to calculate it:
- Add up monthly revenue from all sources: games, attractions, food, events, and admissions.
- Measure your usable floor space, excluding storage and back-of-house.
- Divide monthly revenue by usable square footage.
- Compare that number against your own past quarters, not just other centers.
The benchmark matters more as a trend than a snapshot. A center at $12 per square foot that climbs to $15 over two quarters is healthier than one sitting flat at $18.
How to Calculate Revenue per Square Foot
Run the math by zone, not just for the whole building. Split your floor plan into arcade, attraction, food and beverage, and party rooms.
FEC Labor Cost Optimization Without Cutting Guest Experience
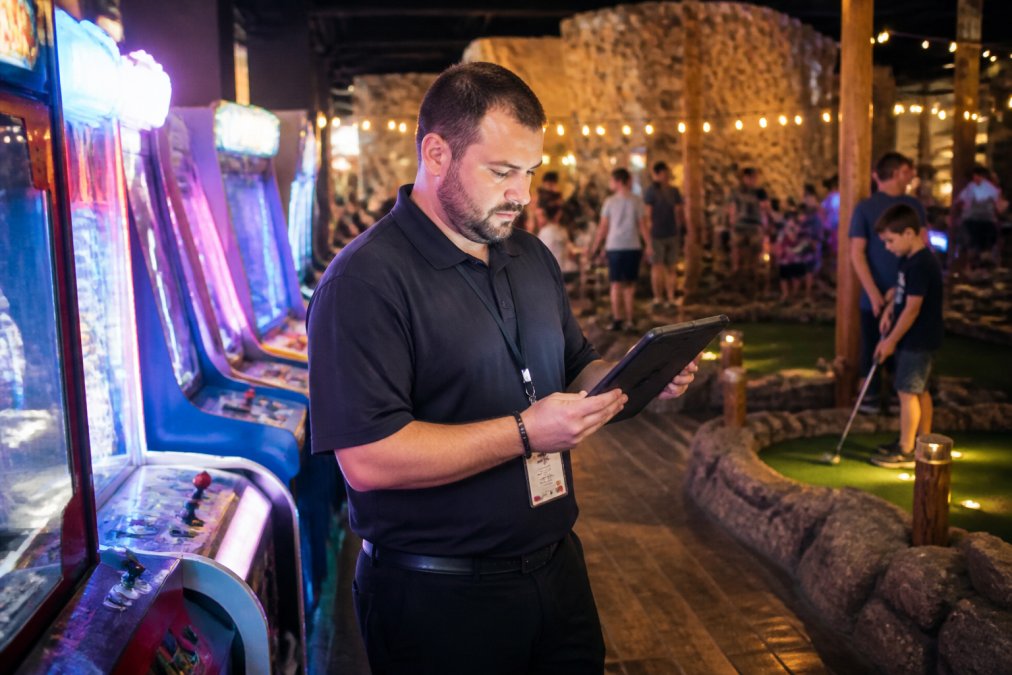
Labor is the largest controllable expense in most centers, and cutting hours blindly destroys guest satisfaction. The goal isn't fewer staff. It's the right staff in the right place at the right time.
Scheduling to Match Peak Demand
Pull two weeks of hourly transaction data. Identify your true peak windows, then build schedules around them.
- Overlap shifts during peak demand so lines move fast
- Trim to a skeleton crew during predictable slow hours
- Cross-train staff so one person can cover arcade and front desk
- Post schedules two weeks out to reduce callouts
Increasing Party and Event Revenue With Higher-Margin Packages
Birthday parties and group events carry some of the best profit margins in a family entertainment center. They're booked in advance, paid upfront, and use space during off-peak hours.
- Base package: admission, one attraction, and a reserved table
- Mid-tier: adds food, a dedicated host, and a gift card for the guest of honor
- Premium: adds a private room, upgraded food, and branded merchandise
Use Dynamic Pricing and Capacity Management to Fill Off-Peak Hours
Dynamic pricing adjusts your rates based on demand. Charge more during peak demand, less during quiet windows, and you smooth out foot traffic without discounting your best hours.
| Time Window | Demand | Pricing Approach | Goal |
|---|---|---|---|
| Weekend evenings | High | Full price, no discounts | Maximize revenue |
| Weekend afternoons | Medium | Standard pricing | Steady throughput |
| Weekday evenings | Low | Discounted bundles | Fill capacity |
| Weekday mornings | Very low | Group and school rates | Drive foot traffic |
Set Price Floors Before You Discount
The most common failure in FEC pricing is discounting below the point where a guest still covers the variable cost of serving them. Before you publish any off-peak rate, calculate the contribution margin of a single guest visit: the cost of the game card or attraction wristband, the food cost of anything bundled, and the incremental labor hours the visit requires. That number is your floor.
Test One Variable at a Time
Pricing changes are easy to make and hard to read. Change one thing per cycle: a single daypart, a single bundle, or a single add-on price. Run it for at least two full weeks so one slow weekend doesn't distort the result, then compare revenue per available hour against the same window in the prior period. If the discounted window produced more total contribution than the full-price window did, keep it. If not, revert.
Capacity Management Protects the Peak
Capacity management pairs with pricing. Cap admissions during peak hours to protect guest satisfaction, then push off-peak deals to your email and loyalty lists. The cap does two things: it keeps wait times tolerable, and it makes the peak window feel scarce, which supports full pricing.
Control Operating Expenses: Energy, Inventory, and Shrinkage
Operating expenses are where most FEC profitability plans quietly leak money. Energy, inventory, and shrinkage rarely get the attention that revenue does, which is exactly why they're worth targeting. Most ranking guides on FEC profitability spend their entire word count on revenue growth and never touch this side of the ledger, which is where the fastest, most durable gains usually sit.
Energy and Utility Management
Arcades, kitchens, and HVAC systems run long hours, and utility management often gets ignored. The fix is scheduling and maintenance discipline, not capital projects.
- Set HVAC schedules to match operating hours, not building hours. A center that conditions the building from 6 a.m. to midnight for a 10 a.m. open is paying for empty square footage.
- Switch to LED lighting in arcades and hallways. Arcade cabinets and game lighting are a meaningful share of a center's electrical load, and LEDs cut that draw while reducing heat that your HVAC then has to remove.
- Service refrigeration and kitchen equipment on a fixed schedule. A walk-in running warm or a fryer with a clogged flue quietly raises both energy and food cost.
- Stage equipment power-downs. Group arcade cabinets and attraction lighting onto circuits you can shut off by zone during slow hours instead of leaving the whole floor lit for a handful of guests.
Inventory Shrinkage and Loss Prevention
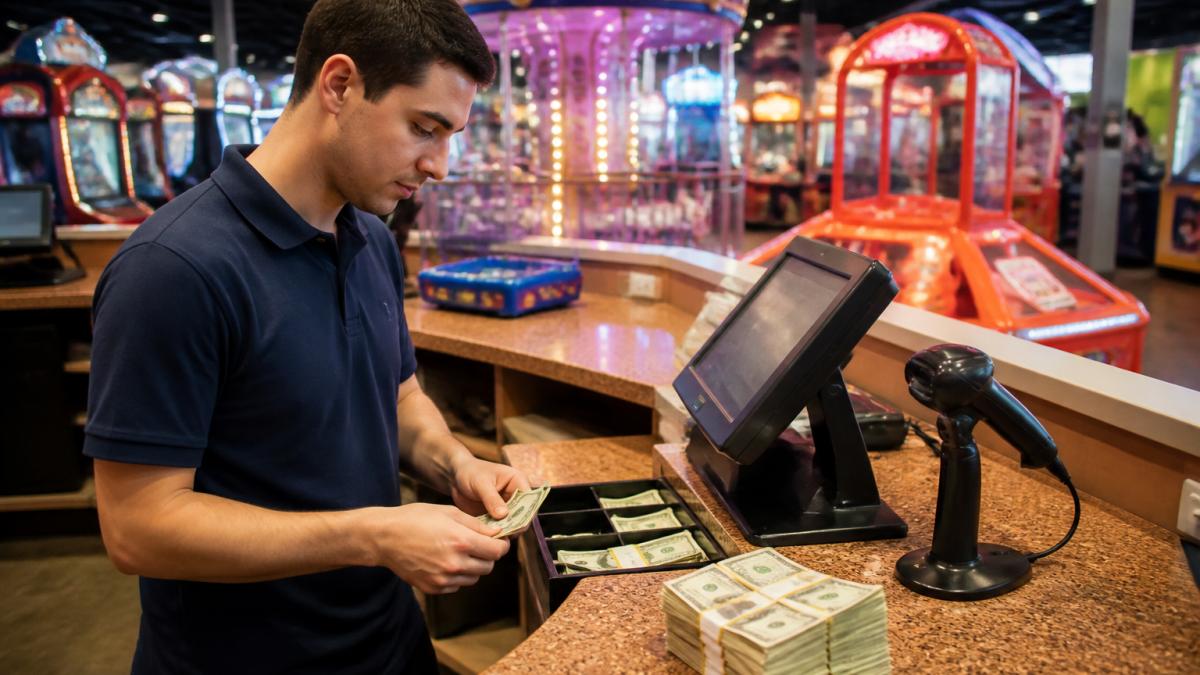
Redemption prizes, food stock, and merchandise all disappear if they aren't tracked. Shrinkage in an FEC rarely looks like a dramatic theft. It looks like a prize case that's counted once a month, a kitchen that eyeballs portion sizes, and a redemption counter where staff hand out tickets without a scan.
Build a simple reconciliation loop:
- Count high-value inventory weekly, not monthly, redemption prizes above a set dollar threshold, alcohol, and any merchandise with resale value.
- Reconcile counts against sales and redemption data. If 40 plush prizes left the shelf but only 32 were redeemed, you have a 20% gap to explain.
- Separate waste from theft. Spoiled food and broken prizes are a purchasing or handling problem; missing stock that never hit a sale is a controls problem. They need different fixes.
- Put redemption behind a scan. Ticket-to-prize redemption that runs through your point-of-sale or game card system creates an automatic audit trail and removes the judgment call from the counter.
U.S. Small Business Administration guidance on managing business finances
Retain Staff and Guests to Build Long-Term Profitability
Staff retention and guest retention are the same problem wearing two hats. High turnover raises labor costs through constant hiring and training. Low guest retention raises marketing costs because you're always chasing new visitors.
- Predictable schedules posted well in advance
- Clear paths to raises or promotion
- Recognition that isn't just a pizza party
Conclusion
The centers that win on FEC profitability aren't the ones with the flashiest attractions. They're the ones that measure revenue per square foot, schedule labor against real traffic, and treat energy and shrinkage as seriously as sales. Most of these fixes cost little and pay back fast.
Frequently Asked Questions
What are the most effective strategies to improve FEC profitability?
Focus on three areas: revenue per square foot, labor cost optimization, and event sales. Start by calculating revenue per square foot to identify underperforming zones. Then adjust staffing to match peak demand and reduce overhead during slow hours. Finally, build higher-margin party and event packages with upselling at booking. Together, these moves improve profit margins without requiring major capital investment.
How do you calculate revenue per square foot in an FEC?
Divide total annual revenue by your total usable square footage. Include all revenue streams: admissions, arcade, food and beverage, parties, and events. Track this metric monthly and compare it to your own past performance to spot underperforming areas.
What are the best ways to reduce operational costs in an entertainment center?
Target energy, inventory, and labor. Install LED lighting and smart HVAC controls to cut utility bills. Use a point-of-sale system to track inventory shrinkage and reorder only what sells. For labor, cross-train staff so one person can handle multiple roles during slow periods. These changes reduce operating expenses without hurting guest satisfaction, and most pay for themselves within a year.
How can specialized programming increase FEC revenue?
Specialized programming like toddler mornings, teen nights, or corporate team-building events fills off-peak hours and attracts new guest segments. These events often have higher margins because they use existing space and staff. Promote them through email and social media to your loyalty program members. Tracking attendance and average transaction value per event helps you double down on what works.