 how-to
How to Analyze FEC Revenue per Square Foot
Last Updated: November 14, 2026
Quick Summary
To analyze FEC revenue per square foot, divide total revenue for a set period by a clearly defined area denominator, tracking both gross floor area and revenue-producing area. Use a rolling twelve months for benchmarks, then pair the result with contribution margin, revenue per guest, and utilization to confirm the density is profitable.
- Track gross floor area for lease decisions and revenue-producing area for attraction-level diagnosis, but never mix the two in comparisons.
- Monthly figures are noisy, so use a rolling twelve months for benchmarks and a trailing three months for trend spotting.
- Divide revenue by zone, since one zone usually carries the building while another drags it.
- Pair revenue density with contribution margin by zone, revenue per guest, occupancy, and labor cost as a percentage of revenue.
- Revisit definitions annually and restate prior periods whenever square footage or allocation rules change.
Table of Contents
- What FEC Revenue per Square Foot Actually Tells You
- Step 1: Define the Area Denominator Before You Divide
- Step 2: Decide Which Revenue Counts and Over What Period
- Step 3: Run the Calculation with a Worked Example
- FEC Revenue per Square Foot Examples Across Facility Types
- FEC Revenue Benchmarks and What Counts as Healthy
- Breaking Down FEC Revenue by Attraction
- Building an FEC Revenue Dashboard Template to Track the Metric
- Frequently Asked Questions
What FEC Revenue per Square Foot Actually Tells You
FEC revenue per square foot is the dollars a family entertainment center collects over a set period divided by the square footage used to generate them. We treat it as a diagnostic, not a scoreboard.
That distinction matters. Two centers with identical sales can post very different numbers per square foot, because one counts every square foot of the building and the other counts only the floor that earns.
Below, we show you exactly how to calculate FEC revenue per square foot with defined inputs, a worked example, and the companion numbers that keep the result honest.
Step 1: Define the Area Denominator Before You Divide
The area denominator is the square footage you divide revenue by, and choosing it is the decision that makes or breaks the comparison. Pick the wrong one and your number becomes a vanity figure.
Three denominators are common:
- Gross floor area: every enclosed square foot, including back offices, restrooms, storage, and mechanical rooms.
- Revenue-producing area: only the floor that hosts paid attractions, plus any food and beverage seating tied to sales.
- Selling area: revenue-producing area plus circulation guests walk through to reach it.
Gross Floor Area vs. Revenue-Producing Area
Gross floor area gives you a conservative, whole-building view. It answers a landlord-style question: what does the entire box return?
Revenue-producing area gives you an operating view. It answers whether the attractions themselves are earning their keep.
Most operators should track both. Use gross floor area for lease and development decisions, and revenue-producing area for attraction-level diagnosis. Just never compare a gross-floor figure from one center against a revenue-producing figure from another. That is the single most common mistake we see in benchmark conversations.
Step 2: Decide Which Revenue Counts and Over What Period
Decide your revenue inclusions first, then lock the measurement period. Changing either between reports makes every comparison meaningless.
Count revenue you can tie to the space: attraction sales, game performance, food and beverage, birthday parties, group events, and event rentals. Exclude pass-through items that are not really sales, such as sales tax collected, gift card balances not yet redeemed, and refunds or chargebacks.
For the measurement period, monthly figures are noisy. Use a rolling twelve months for benchmarks and a trailing three months for trend spotting. Match the period to your accounting close so the number ties to your financial plan.
Step 3: Run the Calculation with a Worked Example
The formula is simple: total revenue for the period divided by the chosen square footage.
Here is how that plays out on a mid-size center:
| Input | Value |
|---|---|
| Gross floor area | 40,000 sq ft |
| Revenue-producing area | 28,000 sq ft |
| Annual revenue | $2,800,000 |
Divide $2,800,000 by 40,000 gross square feet and you get $70 per square foot. Divide the same revenue by 28,000 revenue-producing square feet and you get $100 per square foot. Same business, two very different numbers.
Neither figure is wrong. The gross-floor number tells you what the building returns. The revenue-producing number tells you what the attractions return. Report both, labeled clearly, and your lender or partner can follow the logic.
FEC Revenue per Square Foot Examples Across Facility Types
Facility format changes the expected range more than most operators expect. A bowling-anchored center spreads revenue across a large floor. A compact arcade with a party room concentrates it.
Rather than publish a single national figure, segment your comparisons:
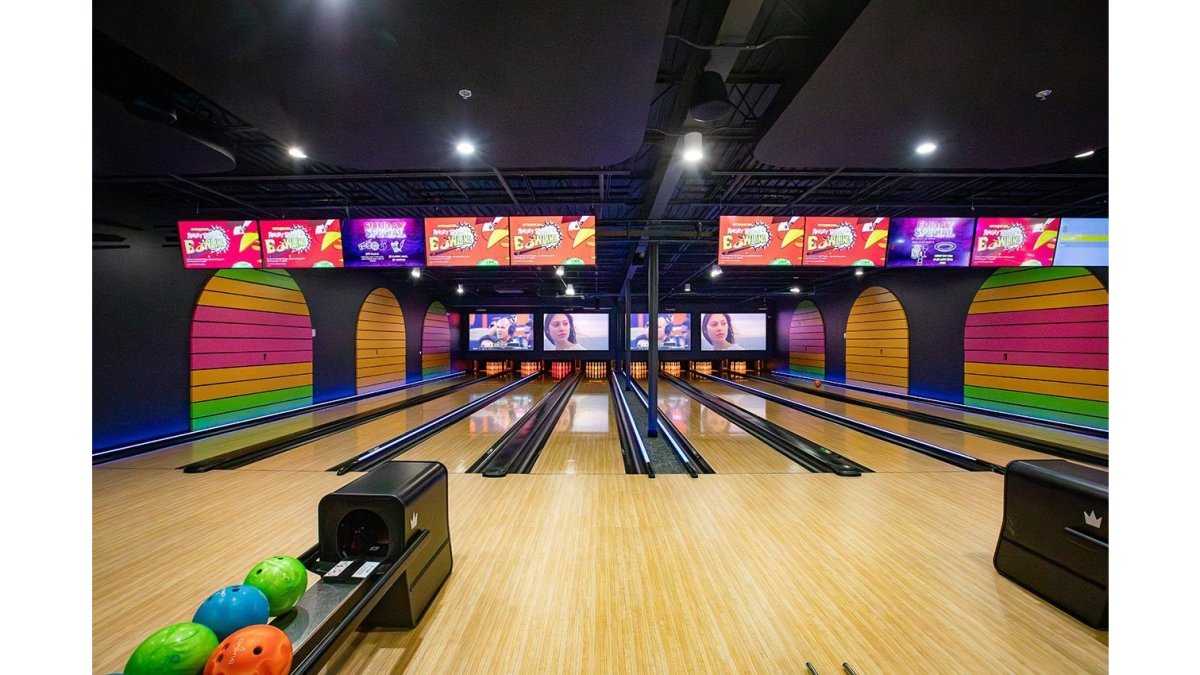
- Bowling and multi-anchor centers: large footprint, revenue spread thin per square foot.
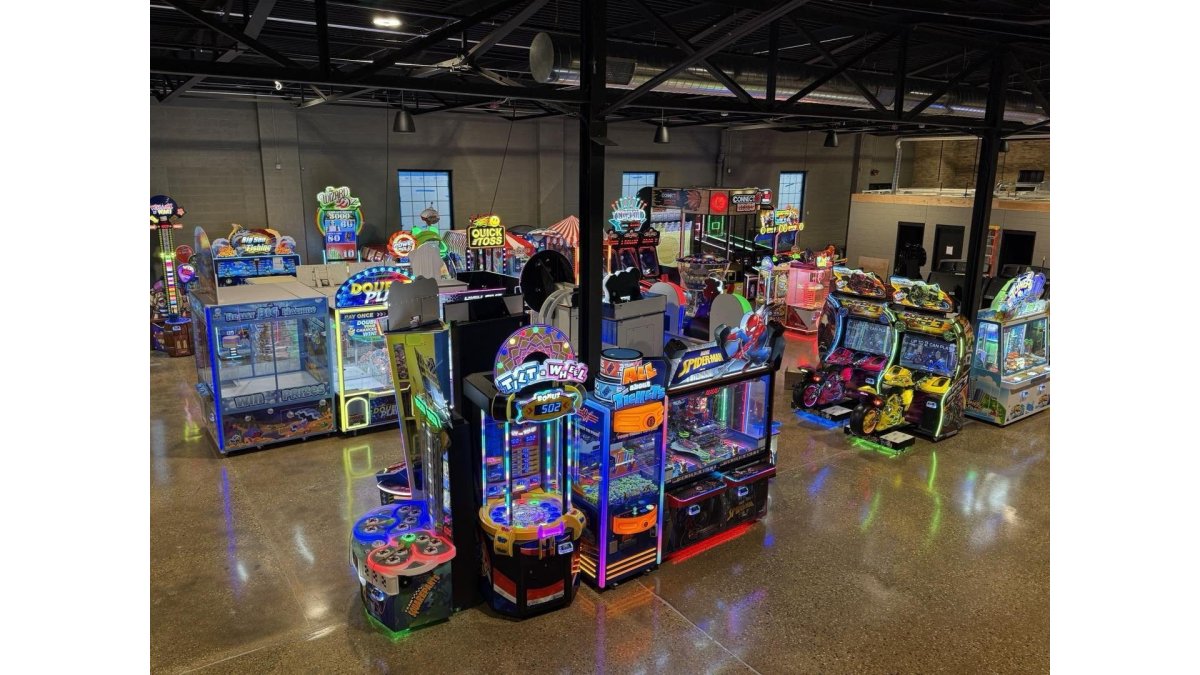
- Arcade-led centers: smaller selling area, higher revenue density.
- Party and event-led centers: revenue tied to peak weekend hours.
- Hybrid food and entertainment venues: F&B lifts total revenue but needs its own cost check.
If you are comparing your facility against formats like these and want an outside read on where your space underperforms, request a consultation to discuss your situation.
FEC Revenue Benchmarks and What Counts as Healthy
A healthy FEC revenue per square foot figure is one that covers operating costs, debt service, and a return on equipment investment at your facility's format and market. There is no universal pass mark, and any source that publishes a single national number is hiding the variance that matters most.
Judge the number three ways:
- Against your own history: is the trend up, flat, or down over the last eight quarters?
- Against your financial plan: does it support the sales projections your business plan assumed?
- Against format-matched peers: same anchor type, similar trade area, similar facility size.
A figure that beats your plan but trails your operating costs is not healthy. It is busy.
Why Benchmarks Vary by Format, Size, and Market
Revenue density is a function of four variables that rarely move together: attraction mix, footprint efficiency, trade-area demographics, and operating model. A bowling-anchored center with a large back-of-house and wide concourses spreads revenue across more square feet than a compact arcade with party rooms, so the bowling center will usually post a lower revenue-per-square-foot figure even when it is the healthier business. A center in a dense suburban trade area with high household income and a young family base will typically outperform a rural center with the same attractions and square footage. An operator running a membership model will show steadier monthly revenue than one dependent on walk-in birthday parties, which concentrates revenue into weekends and school breaks. Because these variables can obscure whether a change reflects the business or its mix, a custom dashboard can track revenue per square foot alongside attraction mix, footprint, trade-area demographics, and operating model, with Studio Blue Creative as a point of reference for shaping that analysis.
Format-matched comparison is generally the most useful comparison to make. Build a peer set of five to ten centers with the same anchor attraction, a footprint within roughly 20 percent of yours, and a trade area with similar population and income characteristics. Pull their revenue per square foot on the same denominator and the same measurement period. If you cannot get peer data, use your own historical range as the benchmark and treat external figures as directional only.
Segmenting Benchmarks by Attraction and Format
Break the benchmark down by attraction before you judge the whole. Calculate revenue per square foot for the arcade, the party rooms, and the F&B area separately. You will usually find one zone carrying the building and one dragging it.
Watch out: comparing a zone-level figure from your center against a whole-building figure from a peer set can make one zone look exceptional and the building look weak, when the real issue is denominator mismatch.
For a broader set of operating measures to read alongside this one, see this guide to key performance indicators for FEC operators.
Breaking Down FEC Revenue by Attraction
Attraction-level revenue tells you which square feet deserve more investment and which deserve redesign. Pull revenue by zone from your point-of-sale system, then divide each zone's revenue by its own square footage.
What most guides miss is that the answer is often reallocation, not expansion. A low-performing corner may need a different attraction mix, not more floor. For guidance on putting that revenue back into your attraction mix, see reinvesting revenue into entertainment attractions.
If you want a deeper look at where revenue can come from across an FEC, review these revenue streams for family entertainment centers.
Building an FEC Revenue Dashboard Template to Track the Metric
An FEC revenue dashboard template should track the metric monthly with fixed inputs, so month-to-month changes reflect performance and not definition drift. Build it once, in a spreadsheet, with these rows:
- Gross floor area and revenue-producing area, updated only when the building changes
- Total revenue, split by attraction, F&B, and events
- Revenue per square foot on both denominators
- Operating costs and profitability, so revenue density is read against margin
- Capacity and use, to explain why a zone moved
Companion KPIs That Keep Revenue Density Honest
Revenue per square foot is a density measure, not a profit measure. Pair it with four companion numbers so a high figure is not mistaken for a healthy one:
- Contribution margin by zone: revenue minus direct variable costs for each attraction. A zone can post high revenue density and thin contribution if discounts, comps, or labor eat the spread.
- Revenue per guest: total revenue divided by unique guests or transactions. Density can rise because more guests visit or because the same guests spend more; the two demand different responses.
- Occupancy and utilization: attraction capacity used during peak and off-peak hours. A zone with high density but low off-peak utilization may be sized wrong rather than priced wrong.
- Labor cost as a percentage of revenue and rent per square foot: the two largest fixed and semi-fixed costs that determine whether density converts to profit.
A common pattern is a center with strong arcade density, weak F&B density, and a labor line that grows faster than revenue during peak weekends. The dashboard should surface that pattern before the monthly close, not after.
Reading the Dashboard Month to Month
Review the dashboard monthly and revisit the definitions annually. When a zone's revenue per square foot moves, check three explanations in order: a change in the denominator (did square footage or allocation change?), a change in the revenue mix (did a promotion shift sales between zones?), or a change in utilization (did hours, capacity, or seasonality shift?).
Watch out: updating square footage or allocation rules mid-year without restating prior periods will make every trend line meaningless and every benchmark comparison invalid.
For tips on turning what the dashboard shows into better margins, read these tips for improving FEC profitability.
Frequently Asked Questions
How do you calculate revenue per square foot for a family entertainment center?
Divide total revenue for a defined period by the square footage you choose as your denominator. For an FEC, pick either gross floor area or revenue-producing area and keep it consistent. Use gross revenue unless you are specifically analyzing margin. For example, if an FEC generates $1,200,000 in annual revenue across 30,000 square feet of revenue-producing area, the result is $40 per square foot. Document the period, the area definition, and what revenue is included so comparisons across months and locations stay valid.
What is a good FEC revenue benchmark to aim for?
There is no single universal number, because FEC revenue benchmarks shift with attraction mix, market size, and format. A facility heavy in arcade and redemption games will show a different figure than one built around bowling, laser tag, or go-karts. The practical approach is to benchmark against your own trailing periods first, then against comparable facilities in similar trade areas. Track the metric monthly and quarterly, and watch the trend rather than chasing a single target.
Should an FEC use gross revenue or net revenue in the calculation?
Most operators use gross revenue because it measures how much the space produces before costs. Net revenue, after discounts, comps, and certain deductions, tells you what the space actually keeps. Run both. If gross revenue per square foot looks healthy but net lags, the gap usually points to discounting, comped play, or event pricing that is eroding value. Pick one as your primary reporting metric and disclose the definition whenever you share the number with lenders or investors.
How can an FEC improve revenue per square foot without adding space?
Improve the metric by raising revenue from the space you already have. Options include rebalancing the attraction mix toward higher-yield activities, adjusting pricing and peak-time rates, growing food and beverage attachment, and booking more private events during slow hours. You can also reassign underused floor area to revenue-producing use. Track FEC revenue by attraction to see which zones underperform, then test changes one at a time so you can attribute the result. Review the metric monthly to confirm the changes are working.